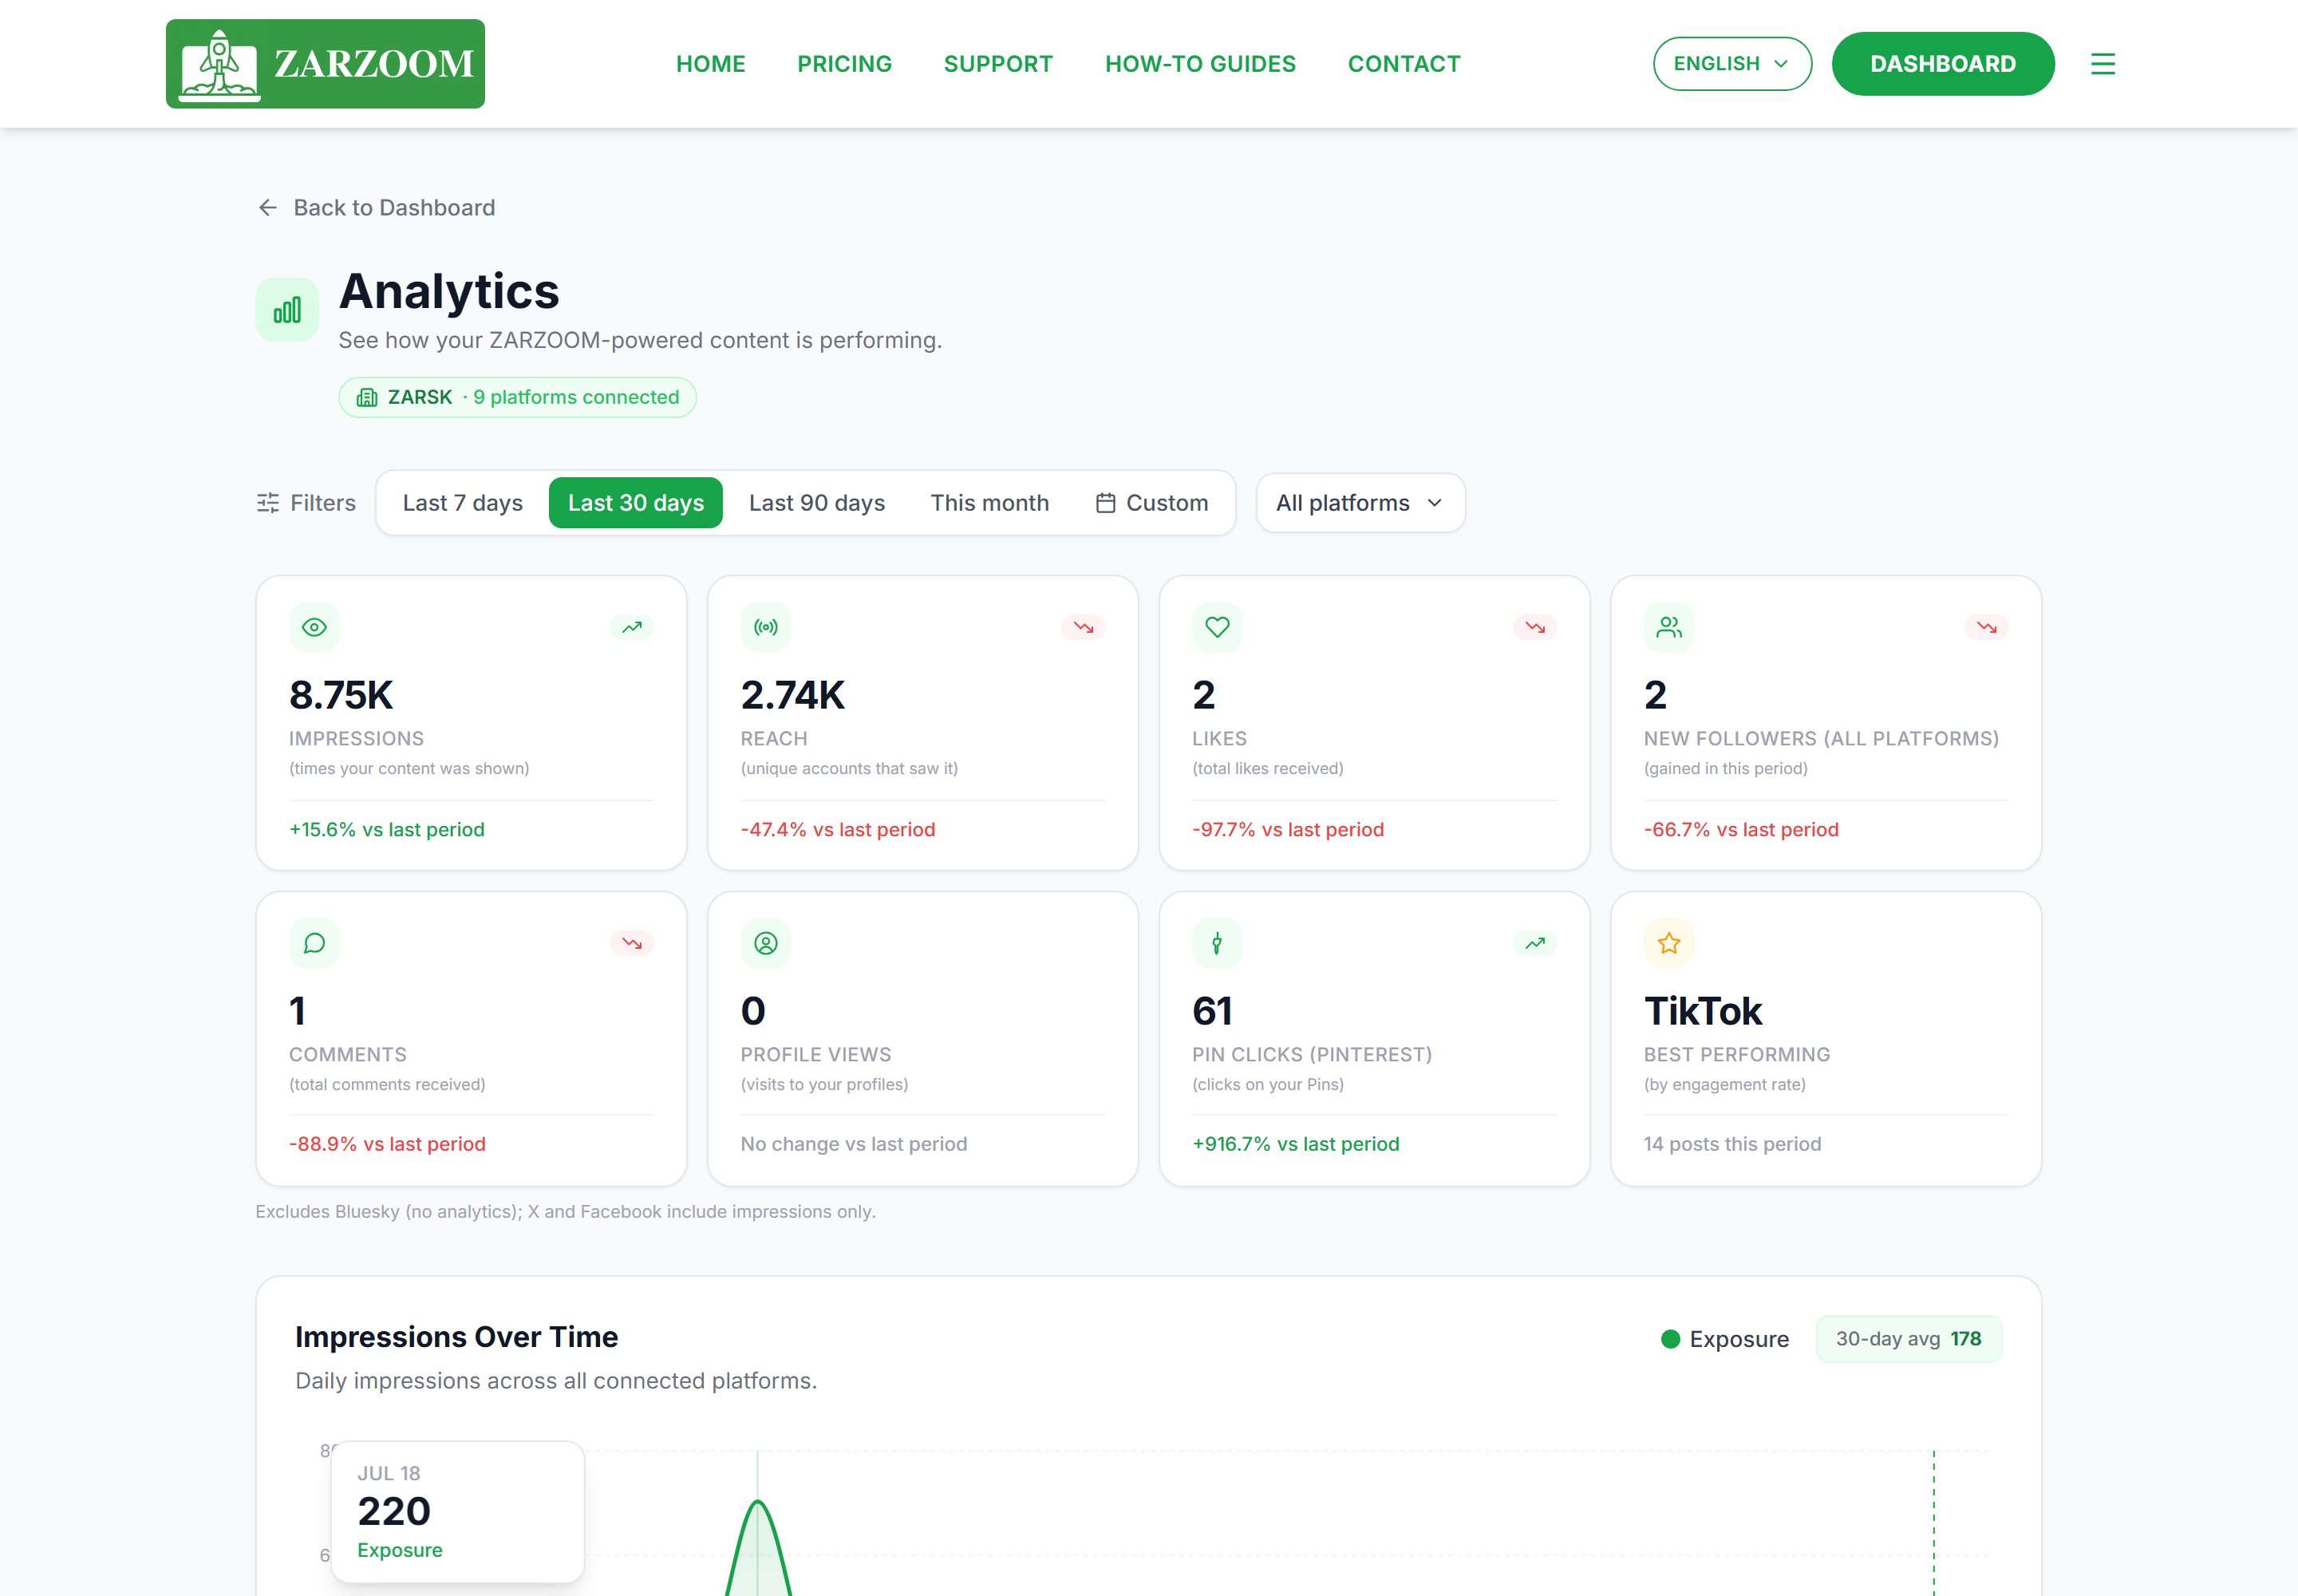
What you'll learn: where to find your numbers, what each part of the page means, and how to tell a real zero from "this platform doesn't report that".
You'll need: at least one connected platform. Analytics can take up to 48 hours to start flowing after connecting.
1. Open Analytics
From your dashboard, choose Analytics in the navigation.
[SCREENSHOT: dashboard navigation with Analytics highlighted]
2. Pick your time window
Use the filter bar for Last 7/30/90 days, This month, This year, or a custom range. Every number on the page follows this window.
[SCREENSHOT: the filter bar with the presets open]
3. Read the headline tiles
The top strip totals your window across all platforms — Impressions, Reach, Likes, New Followers and more, each with a change versus the previous period. The small footnote underneath tells you which platforms are excluded from which totals (for example, Bluesky provides no analytics).
[SCREENSHOT: KPI strip including the footnote]
4. Understand a platform card
Every platform card has the same four slots, in the same order: Exposure · Engagement · Followers · Profile activity.
- A number is a real value from that platform (a real 0 stays 0).
- A — dash means that platform doesn't report the metric — hover or tap it for the explanation.
- … dots mean data hasn't arrived yet (new connection or network delay).
- The exposure slot uses the platform's own name for its number — "Video Views" on TikTok, "Unique Reach" on Instagram, "Impressions" on X.
- Below the core row, an extras strip shows platform-specific numbers such as Pin Clicks (Pinterest) or Videos (TikTok).
[SCREENSHOT: one full platform card with a dash tooltip visible]
5. The ER badge
The engagement-rate badge shows a real same-window percentage — or "ER —" when the platform reports no engagement numbers (hover for why). It is never 0.0% just because a network withholds data.
[SCREENSHOT: two cards side by side — one with a real ER, one with "ER —"]
6. Exposure Share
The donut shows each platform's slice of your total window exposure. It mixes each network's native metric (views, reach, impressions) — the subtitle says so. Tiny real shares show as "<0.1%".
[SCREENSHOT: Exposure Share donut with legend]
7. Top Performing Content
Your best posts, ranked fairly across platforms. Where a network provides no per-post views (Facebook, LinkedIn, Pinterest, X), the rate shows "—" but likes and comments still display.
[SCREENSHOT: top performing content grid]
Tip: a green "Early days" note on a small, recently connected account is just context — new accounts genuinely build reach gradually. It disappears on its own as the account matures.